Showing posts with label threshold. Show all posts

Sunday, June 15, 2014

Big trouble in the Antarctic has been brewing for a long time


Big trouble in the Antarctic has been brewing for a long time
David Spratt, 15 June 2014

"A game changer" is how climate scientist Dr Malte Meinshausen describes newly published research that West Antarctic glaciers have passed a tipping point much earlier than expected and their disintegration is now "unstoppable" at just the current level of global warming. The research findings have shocked the scientific community. "This Is What a Holy Shit Moment for Global Warming Looks Like," ran a headline in Mother Jones magazine.

In the Guardian, lead researcher Dr Eric Rignot explained:

We announced that we had collected enough observations to conclude that the retreat of ice in the Amundsen sea sector of West Antarctica was unstoppable, with major consequences – it will mean that sea levels will rise one metre worldwide. What's more, its disappearance will likely trigger the collapse of the rest of the West Antarctic ice sheet, which comes with a sea level rise of between three and five metres. Such an event will displace millions of people worldwide.But this news should not have come as a shock. In 2007 when we wrote "Climate Code Red", Philip Sutton and I devoted a chapter to Antarctica, and surveyed scientists who were warning of this scenario. We quoted NASA climate chief James Hansen:

We find it implausible that BAU [‘business-as-usual’] scenarios, with climate forcing and global warming exceeding those of the Pliocene, would permit a West Antarctic ice sheet of present size to survive even for a century.As far back as 1968, John Mercer had predicted that the collapse of ice shelves along the Antarctic Peninsula could herald the loss of the ice sheet in West Antarctica, and 10 years later contended that: "a major disaster — a rapid deglaciation of West Antarctica — may be in progress … within about 50 years."

Such science was excluded from "mainstream" reports such as those of the IPCC, which systematically and embarrassing underestimated likely sea-level rises, with the most recent, 2013 report being no exception.

It's par for the course for climate policy-makers to hope for the best, rather than plan for the worst. More than once this blog has warned that sea-level rises are being underestimated by Australian policy-makers, and that the tens of millions of dollars being put into adaptation planning for sea-level rises of no more than 1.1 metres by 2100 will be a waste of money, and all that work will have to be done again. And now that has come to pass.

It's so dumb, but putting politics ahead of science has got us into this mess, and there is little sign that even peer-reviewed evidence that West Antarctic has passed a tipping point for partial or total collapse of its ice sheets will get those in power to acknowledge scientific reality.

So here, for the record, is what we said back in late 2007.

Climate Code Red (extract): Antarctica

Big changes are also underway at the other end of the world, in the Antarctic, where most of the world’s ice sits on the fifth largest continent. The majority of Antarctic ice is contained in the East Antarctic ice sheet — the biggest slab of ice on Earth, which has been in place for some 20 million years and which, if fully melted, would raise sea levels by more than 60 metres.

Considered more vulnerable is the smaller West Antarctic ice sheet, which contains one-tenth of the total Antarctic ice volume. If it disintegrated, it would raise sea levels by around 5 metres, a similar amount to what we would see with a total loss of the Greenland ice sheet.

While it was generally anticipated that the West Antarctic sheet would be more stable than Greenland at a 1–2 degree rise, recent research demonstrates that the southern ice shelf reacts far more sensitively to warming temperatures than scientists had previously believed. Ice-core data from the Antarctic Geological Drilling joint project (being conducted by Germany, Italy, New Zealand, and the United States) shows that ‘massive melting’ must have occurred in the Antarctic three million years ago, during the Miocene–Pliocene period, when the average global temperature in the oceans increased by only 2–3 degrees above the present temperature. Geologist Lothar Viereck-Götte called the results ‘horrifying’, and suggested that ‘the ice caps are substantially more mobile and sensitive than we had assumed’.

The heating effect caused by climate change is greatest at the poles, and the air over the West Antarctic peninsula has warmed nearly 6 degrees since 1950. At the same time, according to a report in the Washington Post on 22 October 2007, a warming sea is melting the ice-cap edges, and beech trees and grass are taking root on the ice fringes.

Another warning sign was the rapid collapse in March 2002 of the 200-metre-thick Larsen B ice shelf, which had been stable for at least twelve thousand years, and which was the main outlet for glaciers draining from West Antarctica. An ice shelf is a floating sheet, or platform, of ice. Largely submerged, and up to a kilometre thick, the shelf abuts the land and is formed when glaciers or land-based ice flows into the sea. Generally, an ice shelf will lose volume by calving icebergs, but these are also subject to rapid disintegration events. Larsen B, weakened by water-filled cracks where its shelf attached to the Antarctic Peninsula, gave way in a matter of days, releasing five hundred billion tonnes of ice into the ocean.

Neil Glasser of Aberystwyth University and Ted Scambos from the NSIDC found that as glacier fl ow had begun to increase during the 1990s, the ice shelf had become stressed. The warming of deep Southern Ocean currents (which increasingly reach the Antarctic coastline) had also led to some thinning of the shelf, making it more prone to breaking apart. Scambos concludes that ‘the unusually warm summer of 2002, part of a multi-decade trend of warming [that is] clearly tied to climate change, was the final straw’.

Looking at the overall pace of events, Scambos says: ‘We thought the southern hemisphere climate is inherently more stable, [but] all of the time scales seem to be shortened now. These things can happen fairly quickly. A decade or two of warming is all you need to really change the mass balance … Things are on more of a hair trigger than we thought.’

Much of the West Antarctic ice sheet sits on bedrock that is below sea level, buttressed on two sides by mountains, but held in place on the other two sides by the Ronne and Ross ice shelves; so, if the ice shelves that buttress the ice sheet disintegrate, sea water breeching the base of the ice sheet will hasten the rate of disintegration.

In 1968, the Ohio State University glaciologist John Mercer warned, in the journal of the International Association of Scientific Hydrology, that the collapse of ice shelves along the Antarctic Peninsula could herald the loss of the ice sheet in West Antarctica. A decade later, in 1978, his views received a wider audience in Nature, where he wrote: ‘I contend that a major disaster — a rapid deglaciation of West Antarctica — may be in progress … within about 50 years.’ Mercer said that warming ‘above a critical level would remove all ice shelves, and consequently all ice grounded below sea level, resulting in the deglaciation of most of West Antarctica’. Such disintegration, once under way, would ‘probably be rapid, perhaps catastrophically so’, with most of the ice sheet lost in a century. Credited with coining the phrase ‘the greenhouse effect’ in the early 1960s, Mercer’s Antarctic prognosis was widely ignored and disparaged at the time, but this has changed.

(James Hansen says it was not clear at the time whether Mercer or his many critics were correct, but those who labelled Mercer an alarmist were considered more authoritative and better able to get funding. Hansen believes funding constraints can inhibit scientific criticisms of the status quo. As he wrote in New Scientist on 28 July 2007: ‘I believe there is pressure on scientists to be conservative.’ Hansen is responsible for coining the term ‘The John Mercer Effect’, meaning to play down your findings for fear of losing access to funding or of being considered alarmist.)

Another vulnerable place on the West Antarctic ice sheet is Pine Island Bay, where two large glaciers, Pine Island and Thwaites, drain about 40 per cent of the ice sheet into the sea. The glaciers are responding to rapid melting of their ice shelves and their rate of fl ow has doubled, whilst the rate of mass loss of ice from their catchment has now tripled. NASA glaciologist Eric Rignot has studied the Pine Island glacier, and his work has led climate writer Fred Pearce to conclude that ‘the glacier is primed for runaway destruction’. Pearce also notes the work of Terry Hughes of the University of Maine, who says that the collapse of the Pine Island and Thwaites glaciers — already the biggest causes of global sea-level rises — could destabilise the whole of the West Antarctic ice sheet. Pearce is also swayed by geologist Richard Alley, who says there is ‘a possibility that the West Antarctic ice sheet could collapse and raise sea levels by 6 yards [5.5 metres]’, this century.

Hansen and fellow NASA Goddard Institute for Space Studies researcher Makiko Sato agree:

The gravest threat we foresee starts with surface melt on West Antarctica, and interaction among positive feedbacks leading to catastrophic ice loss. Warming in West Antarctica in recent decades has been limited by effects of stratospheric ozone depletion. However, climate projections find surface warming in West Antarctica and warming of nearby ocean at depths that may attack buttressing ice shelves. Loss of ice shelves allows more rapid discharge from ice streams, in turn a lowering and warming of the ice sheet surface, and increased surface melt. Rising sea level helps unhinge the ice from pinning points … Attention has focused on Greenland, but the most recent gravity data indicate comparable mass loss from West Antarctica. We find it implausible that BAU [‘business-as-usual’] scenarios, with climate forcing and global warming exceeding those of the Pliocene, would permit a West Antarctic ice sheet of present size to survive even for a century.Even in East Antarctica, where total ice loss would produce a sea-level rise of 60 metres, mass loss near the coast is greater than the mass increase inland (mass increase inland is caused by the extra snowfall generated from warming-induced increases in air humidity).

While the inland of East Antarctica has cooled during the last 20 years, the coast has become warmer, with melting occurring 900 kilometres from the coast and in the Transantarctic Mountains, which rise up to an altitude of 2 kilometres.

Research published in January 2008 by Rignot and six of his colleagues shows that ice loss in Antarctica has increased by 75 per cent in the last ten years due to a speed-up in the flow of its glaciers, so that the ice loss there is now nearly a great as that observed in Greenland.

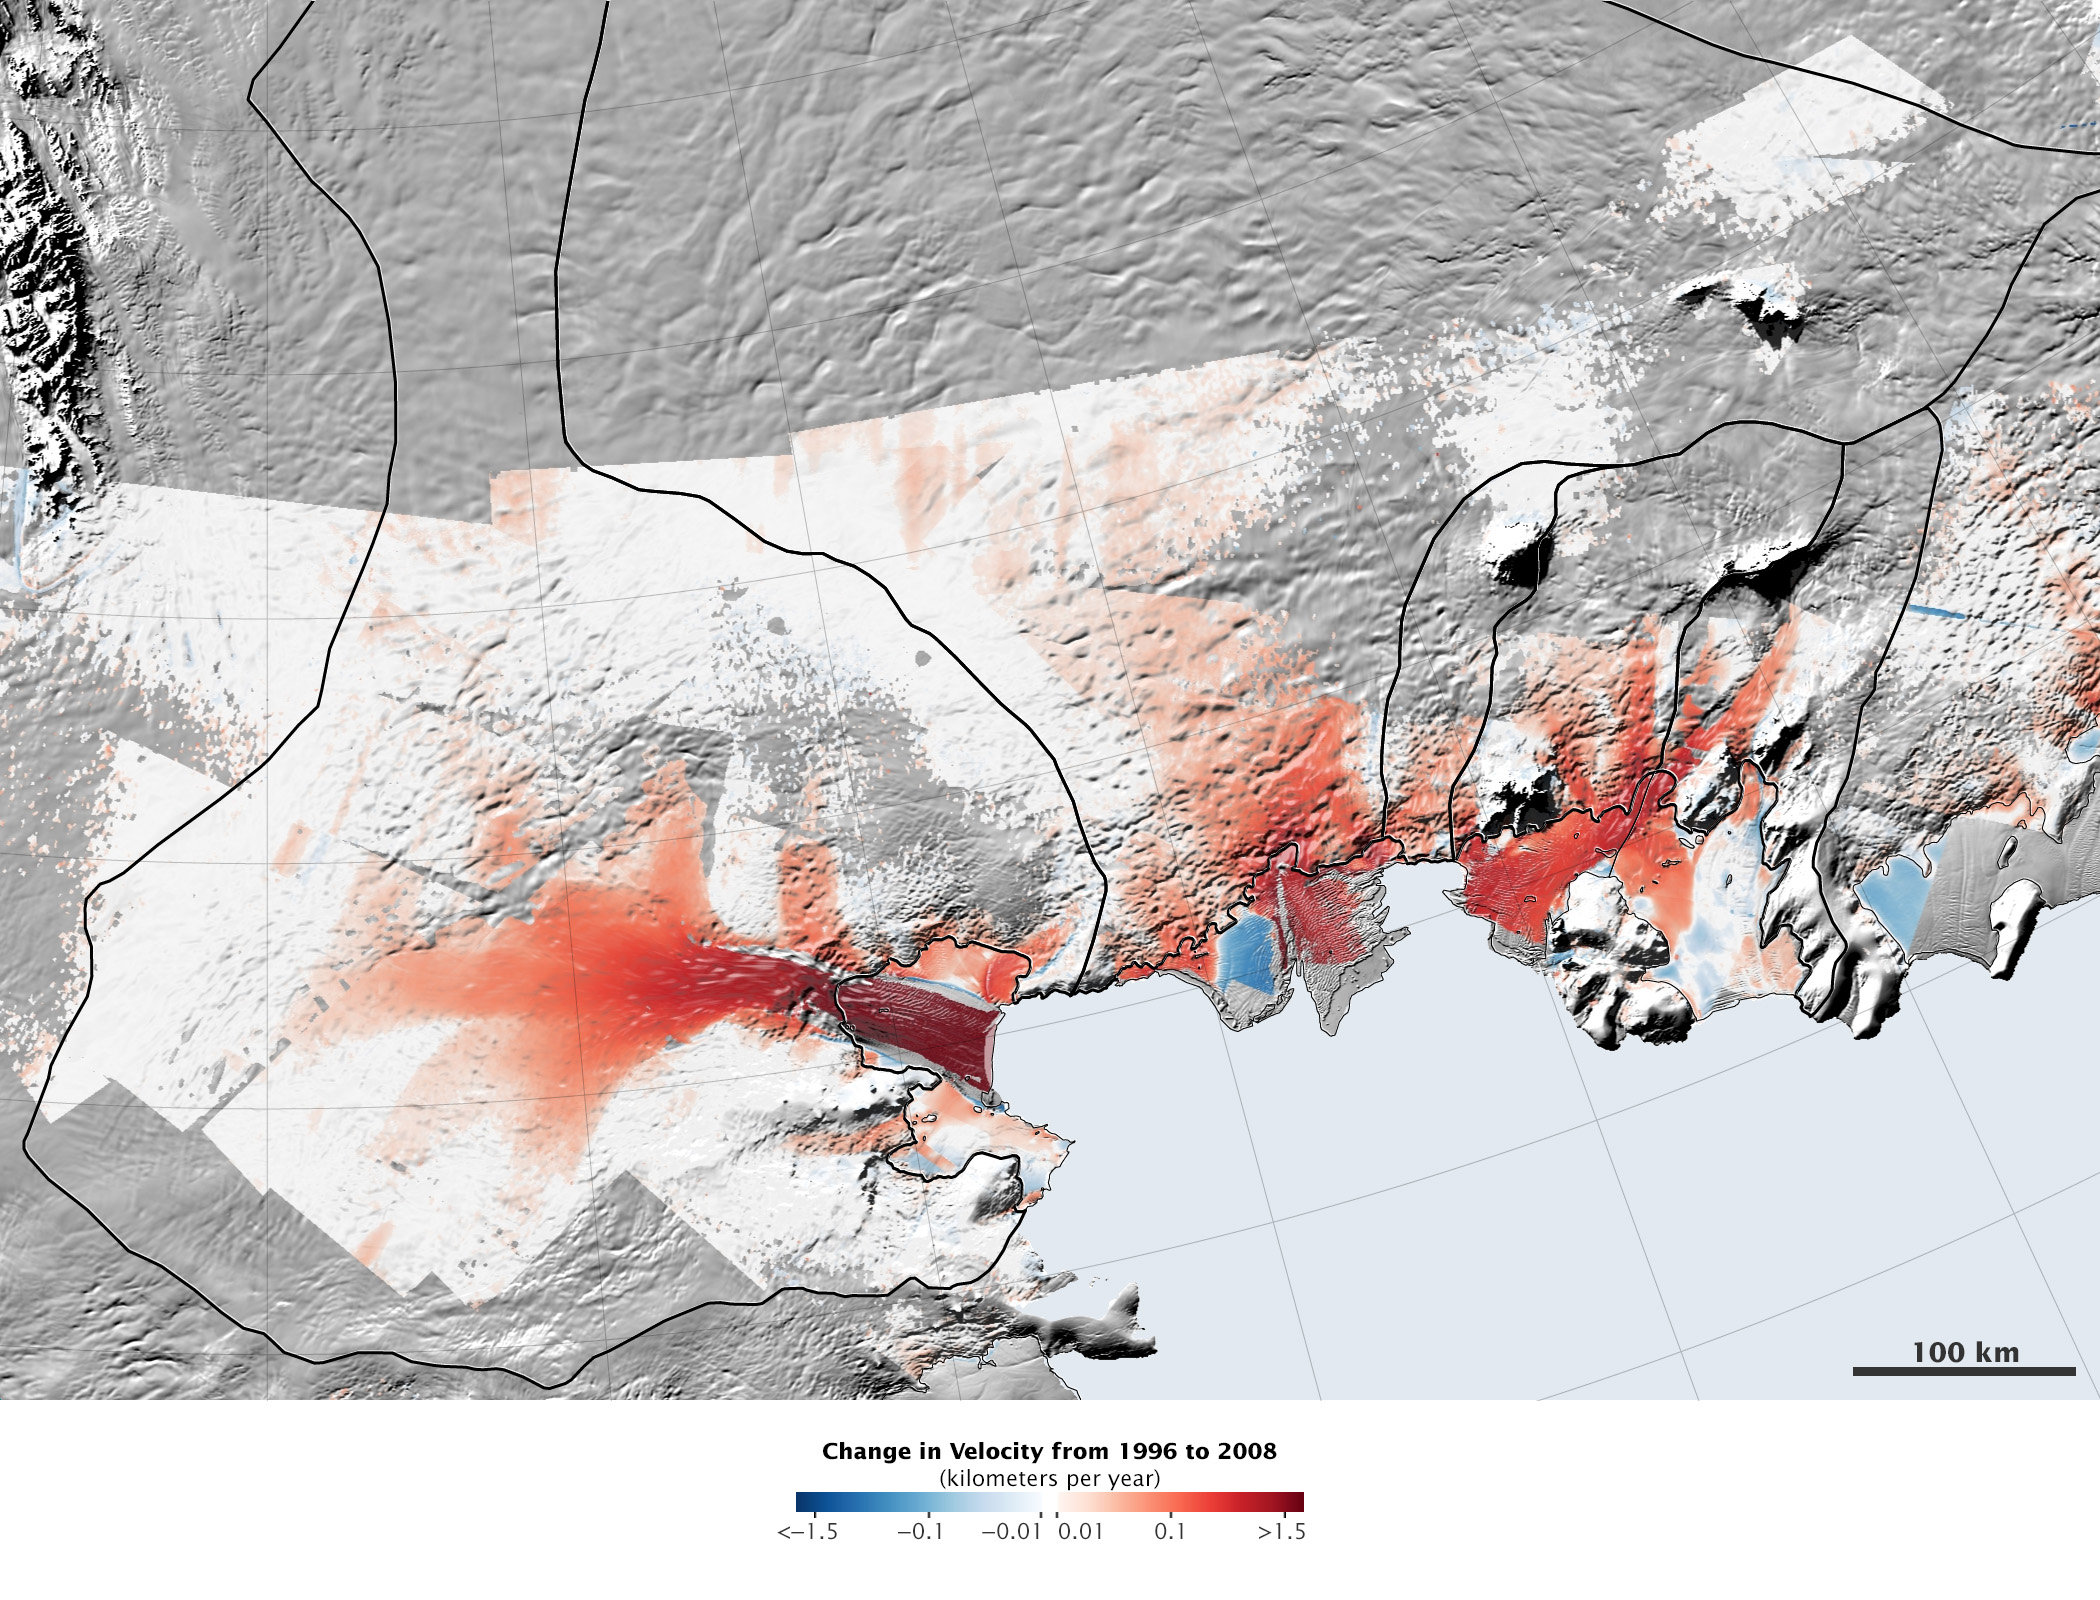
Tuesday, May 20, 2014

Decline of West Antarctic Glaciers Appears Irreversible


acquired 1996 - 2008 download large image (896 KB, JPEG, 2100x1600)

Decline of West Antarctic Glaciers Appears Irreversible
May 16, 2014 NASA

Two studies published this week conclude that a section of the West Antarctic ice sheet has reached a point of inevitable collapse, an event that would eventually raise sea levels more than a meter (three-plus feet). The first study, led by Eric Rignot of the Jet Propulsion Laboratory, used NASA satellite and airborne observations to measure how glaciers have been retreating in the region. The other study, led by Ian Joughin of the University of Washington, used a computer model to compare observations of recent melting with projected melt scenarios to see which matches reality best so far. Both studies conclude that the Amundsen Sea segment of the ice sheet has begun an irreversible decline that will result in its loss, possibly as soon as the next few hundred years.

Called the weak underbelly of the West Antarctic ice sheet, the Amundsen Sea region contains several fast-moving glaciers, including Pine Island, Thwaites, Haynes, Pope, Smith, and Kohler. Many Antarctic glaciers have offshore ice shelves that hold them in place like a dam. But there is very little fixed, offshore ice in the Amundsen Sea, so the glaciers flow freely. These rivers of ice drain one third of the West Antarctic ice sheet.


In a separate study published in March 2014 in Geophysical Research Letters, Rignot and colleagues Jeremie Mouginot and Bernd Scheuchl found that these glaciers have been speeding up, as shown in the map above. Changes in ice flow between 1996 and 2008 are shown in red (accelerating) and blue (slowing). The changes were calculated from a variety of satellite observations, including visible light and radar observations that measure how fast the surface is moving, and satellite altimeter measurements of the height of the ice (for estimating thickness). Most of the glaciers have been flowing faster, and the changes extend far inland.

Rignot’s May 2014 recent paper examines why the glaciers have been flowing more quickly and what that means for the future of the Amundsen Sea Embayment. First, the team identified the grounding line for each glacier; that is, the place where the ice is anchored to the coast or seafloor. Beyond that point, the glaciers float on ocean water. The floating segments rise and fall with the tides. Rignot and his team used satellite radar interferometry to map changes in ice height over time and identify the grounding lines.

“The grounding line is buried under a thousand or more meters of ice, so it is incredibly challenging for a human observer on the ice sheet surface to figure out exactly where the transition is,” Rignot said. “This analysis is best done using satellite techniques.”

Across the region, grounding lines retreated significantly between 1992 and 2011. For instance, the Pine Island glacier grounding line has moved 31 kilometers inland. Smith/Kohler glaciers retreated 35 kilometers, Thwaites retreated 14 kilometers, and Haynes retreated 10 kilometers. This movement suggests further declines in the future. Most melting happens from below, when warm ocean currents undercut and thin the ice. Water also eliminates friction beneath the glacier, allowing ice to flow more quickly. As the ice flows, it thins and becomes lighter, allowing more of it to float and the grounding line to retreat more.

The glaciers in the Amundsen Sea region have entered this vicious cycle, and there seems to be nothing to slow or stop the melt. The land beneath the glaciers lies below sea level, and it slopes down toward the center of the ice sheet. Any water that flows beneath the glaciers will move downhill away from the coast, undercutting the glaciers even more. Rignot’s team analyzed the underlying topography and found no hills or bumps that might stop the water or this melt cycle. Rignot explains how these elements come together in the following animation:

These three things—the accelerating melt rate, the retreating grounding lines, and no speed bumps—all point to the eventual collapse of the Amundsen Sea portion of the West Antarctic ice sheet. That conclusion is supported by Joughin’s modeling study, which found that the Thwaites glacier is on pace to collapse in as little as 100 to 200 years (some scenarios give the glacier as many as 1,000 years). This segment of the ice sheet contains enough ice to raise sea levels by 1.2 meters (4 feet).

References
AntarcticGlaciers.org (2014, May 14) A note on ‘collapse.’ Accessed May 15, 2014.
AntarcticGlaciers.org (2014, May 13) Is the West Antarctic ice sheet collapsing? Accessed May 15, 2014.
Joughin, I., Smith, B.E., and Medley, B. (2014, May 12) Marine ice sheet collapse potentially underway for the Thwaites glacier basin, West Antarctica. Science. Accessed May 15, 2014.
Mouginot, J. Rignot, E, and Scheuchl, B. (2014, March 16) Sustained increase in ice discharge from the Amundsen Sea Embayment, West Antarctica, from 1973 to 2013. Geophysical Research Letters. Accessed May 15, 2014.
NASA (2014, May 12) NASA-UCI study indicates loss of West Antarctic glaciers appears unstoppable. Accessed May 15, 2014.
NASA (2014, May 12) The “unstable” West Antarctic ice sheet: a primer. Accessed May 15, 2014.
NASA (2014, May 12) West Antarctica media teleconference. Accessed May 15, 2014.
Rignot, E. et al. (2014) Widespread, rapid grounding line retreat of Pine Island, Thwaites, Smith and Kohler glaciers, West Antarctica from 1992 to 2011. Geophysical Research Letters. Accessed May 15, 2014.

Image courtesy Jeremie Mouginot, University of California, Irvine, originally published in Geophysical Research Letters.Caption by Holli Riebeek.

Thursday, March 27, 2014

Michael Mann: The irreversible impacts from Climate Change


Michael Mann: The irreversible impacts from Climate Change

Mike Mann discusses his new piece in Scientific American, which outlines critical thresholds in climate warming in the not-too-far-off future, based on the sensitivity of Earth climate.

Scientific American: Most scientists concur that two degrees C of warming above the temperature during preindustrial time would harm all sectors of civilization—food, water, health, land, national security, energy and economic prosperity. ECS is a guide to when that will happen if we continue emitting CO2 at our business-as-usual pace.

I recently calculated hypothetical future temperatures by plugging different ECS values into a so-called energy balance model, which scientists use to investigate possible climate scenarios. The computer model determines how the average surface temperature responds to changing natural factors, such as volcanoes and the sun, and human factors—greenhouse gases, aerosol pollutants, and so on. (Although climate models have critics, they reflect our best ability to describe how the climate system works, based on physics, chemistry and biology. And they have a proved track record: for example, the actual warming in recent years was accurately predicted by the models decades ago.)


I then instructed the model to project forward under the assumption of business-as-usual greenhouse gas emissions. I ran the model again and again, for ECS values ranging from the IPCC’s lower bound (1.5 degrees C) to its upper bound (4.5 degrees C). The curves for an ECS of 2.5 degrees and three degrees C fit the instrument readings most closely. The curves for a substantially lower (1.5 degrees C) and higher (4.5 degrees C) ECS did not fit the recent instrumental record at all, reinforcing the notion that they are not realistic.

To my wonder, I found that for an ECS of three degrees C, our planet would cross the dangerous warming threshold of two degrees C in 2036, only 22 years from now. When I considered the lower ECS value of 2.5 degrees C, the world would cross the threshold in 2046, just 10 years later [see graph on pages 78 and 79].

So even if we accept a lower ECS value, it hardly signals the end of global warming or even a pause. Instead it simply buys us a little bit of time—potentially valuable time—to prevent our planet from crossing the threshold.

Cautious Optimism

These findings have implications for what we all must do to prevent disaster. An ECS of three degrees C means that if we are to limit global warming to below two degrees C forever, we need to keep CO2 concentrations far below twice preindustrial levels, closer to 450 ppm. Ironically, if the world burns significantly less coal, that would lessen CO2 emissions but also reduce aerosols in the atmosphere that block the sun (such as sulfate particulates), so we would have to limit CO2 to below roughly 405 ppm.

We are well on our way to surpassing these limits. In 2013 atmospheric CO2 briefly reached 400 ppm for the first time in recorded history—and perhaps for the first time in millions of years, according to geologic evidence. To avoid breaching the 405-ppm threshold, fossil-fuel burning would essentially have to cease immediately. To avoid the 450-ppm threshold, global carbon emissions could rise only for a few more years and then would have to ramp down by several percent a year. That is a tall task. If the ECS is indeed 2.5 degrees C, it will make that goal a bit easier.

Friday, March 21, 2014

Tuesday, March 18, 2014

400 PPM 'Just a Matter of Time' Before We Cross Climate Threshold 'Forever'


400 PPM 'Just a Matter of Time' Before We Cross Climate Threshold 'Forever'

Fossil fuel burning increasing greenhouse gases to levels 'not seen in human history'
- Jacob Chamberlain, March 18, 2014 by Common Dreams

The graph known as the Keeling Curve shows steady rise in carbon dioxide and seasonal variations (NOAA Earth System Research Laboratory/Scripps Institute of Oceanography)Climate scientists have long said that the earth cannot withstand more than 400 parts per million of carbon dioxide in the atmosphere for very long without tipping the scales against human life once and for all.

And according to Ralph Keeling, who runs the carbon dioxide monitoring program at the Scripps Institute of Oceanography, that atmospheric concentration was recorded last week for the first time this year, two months earlier than last. Now, warns Keeling, it is only a matter of time before the atmosphere permanently maintains those levels.

"We’re already seeing values over 400. Probably we’ll see values dwelling over 400 in April and May. It’s just a matter of time before it stays over 400 forever,” said Keeling whose team at Scripps have taken daily measurements from the Mauna Loa Observatory in Hawaii since March 1958 when carbon was at 313 ppm.

The 400 parts per million threshold was first recorded during a brief moment in the month of May last year, notes Brian Kahn at Climate Central. It was the first time carbon levels had reached that high in human history.

But as Robert Monroe writes on Keeling's blog, "Fossil fuel burning continues to increase concentrations of the greenhouse gas to levels not seen in human history and not in perhaps as many as 3 to 5 million years."

According to Monroe:
Instruments at the Mauna Loa Observatory in Hawaii recorded atmospheric levels of carbon dioxide greater than 400 parts per million on March 12, 2014 nearly two months earlier than the date on which the milestone was passed in 2013. 
Scripps Institution of Oceanography, UC San Diego, reported a reading of 401.62 ppm on March 12 and a reading of 400.2 on March 13. Readings by instruments operated by NOAA also exceeded 400 ppm on those days.
In a related story on Tuesday, the American Association for the Advancement of Science (AAAS) released a series of key messages and videos calling on Americans to wake up to the threat of climate change, which is likely to cause "abrupt, unpredictable and potentially irreversible" changes to the world's ecosystems and subsequently the lives of billions of people. Americans must act quickly to reduce greenhouse gas emissions and avoid the worst case climate-change scenario, the scientists warn.